Bitcoin remains under selling pressure below the $70,000 level as the market confronts renewed uncertainty and weakening liquidity conditions. The inability to reclaim this key psychological threshold has reinforced a cautious tone among investors, with price action reflecting a broader struggle across risk assets. While volatility remains elevated, the current environment suggests that market participants are increasingly focused on liquidity trends and capital flows rather than short-term price momentum alone.
An analysis by Axel Adler highlights two important liquidity indicators pointing to ongoing market weakness. The Stablecoin Supply Ratio (SSR) Oscillator has moved back into negative territory after briefly turning positive in January, indicating that Bitcoin continues to underperform relative to stablecoin dynamics. Historically, positive SSR readings have coincided with stronger price appreciation, while persistent negative readings tend to align with periods of price stagnation or decline.

At the same time, the 30-day change in USDT market capitalization has fallen to approximately -$2.87 billion, signaling capital outflows from the crypto ecosystem. Together, these indicators suggest that January’s attempted recovery lacked sustained liquidity support. Unless stablecoin inflows return and the SSR oscillator stabilizes in positive territory for several weeks, the broader market context may remain risk-off, leaving Bitcoin vulnerable to continued pressure in the near term.
Stablecoin Liquidity Trends Reinforce Bitcoin Market Weakness
Axel Adler’s analysis emphasizes the importance of stablecoin liquidity as a leading indicator for Bitcoin market conditions. The 30-day change in USDT market capitalization functions as a directional gauge of dollar liquidity entering or leaving the crypto ecosystem. Positive readings typically signal fresh capital inflows that can support price appreciation, while negative values indicate liquidity contraction and reduced risk appetite among market participants.

According to the data, January briefly showed signs of recovery. The 30-day USDT market cap change moved into positive territory, reaching approximately $1.4 billion during the first week of the month. This inflow coincided with the Stablecoin Supply Ratio (SSR) Oscillator’s attempt to move into positive territory, alongside a short-term rebound in Bitcoin price. However, the trend reversed later in January, and the latest reading near -$2.87 billion confirms renewed capital outflows.
The alignment between these two indicators appears consistent rather than coincidental. Liquidity inflows helped support January’s temporary recovery, while the return of outflows accompanied the subsequent market weakness.
As long as the 30-day USDT change remains negative, a sustained SSR recovery appears unlikely. Together, these signals suggest the market has shifted back into a risk-off environment, reinforcing the view that the recent rebound lacked durable liquidity support.
Bitcoin Remains Under Pressure After Breakdown Below Key Averages
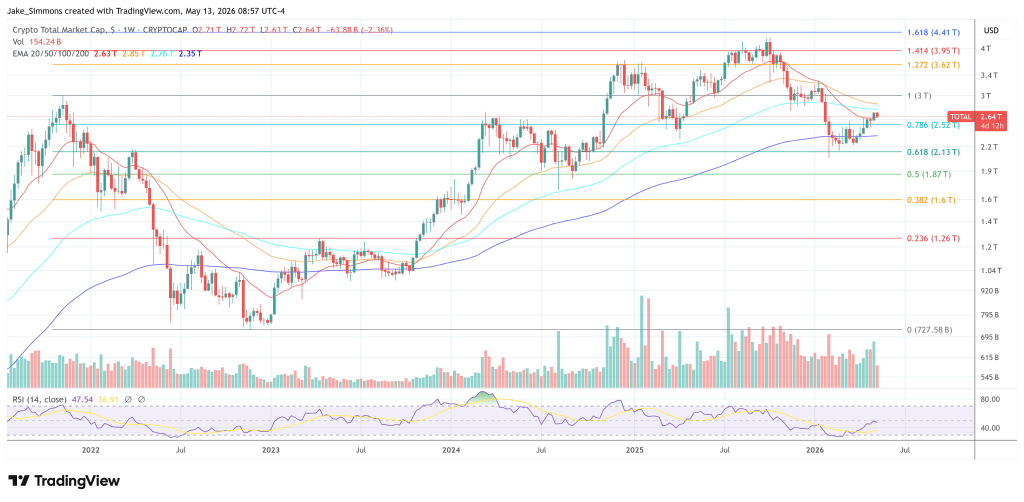
Bitcoin’s daily chart continues to reflect sustained bearish momentum following the loss of the $70,000 level, with price now consolidating in the mid-$60,000 range after a sharp decline. The recent breakdown below this psychological threshold coincided with a decisive move under major moving averages, which have shifted from support to resistance. This structural change typically signals weakening bullish control and increasing caution among market participants.

Price action shows a sequence of lower highs since late 2025, suggesting a gradual deterioration in market structure rather than an isolated correction. The latest drop was accompanied by a notable surge in trading volume, often associated with forced deleveraging or defensive repositioning rather than steady accumulation. This dynamic can increase short-term volatility while delaying meaningful recovery attempts.
From a technical perspective, the $60,000–$62,000 region now represents the primary support zone. This area aligns with prior consolidation ranges and historically strong liquidity clusters that could attract demand. Holding this zone would support a stabilization scenario, potentially leading to sideways consolidation. Conversely, a decisive break below it could open the door to deeper retracement phases.
Until Bitcoin reclaims key moving averages and restores higher-high price structure, the market is likely to remain sensitive to liquidity conditions, macro sentiment, and derivatives positioning.
Featured image from ChatGPT, chart from TradingView.com

You can get bonuses upto $100 FREE BONUS when you:
💰 Install these recommended apps:
💲 SocialGood - 100% Crypto Back on Everyday Shopping
💲 xPortal - The DeFi For The Next Billion
💲 CryptoTab Browser - Lightweight, fast, and ready to mine!
💰 Register on these recommended exchanges:
🟡 Binance🟡 Bitfinex🟡 Bitmart🟡 Bittrex🟡 Bitget
🟡 CoinEx🟡 Crypto.com🟡 Gate.io🟡 Huobi🟡 Kucoin.


Comments